The MLS® Home Price Index (HPI) is the most advanced and accurate tool to gauge a neighbourhood’s home price levels and trends. Each month, the MLS® HPI uses more than 15 years of MLS® System data and sophisticated statistical models to define a “typical” home based on the features of homes that have been bought and sold. These benchmark homes are tracked across Canadian neighbourhoods and different types of houses. REALTORS® have exclusive access to the MLS® HPI, providing them with the most up-to-date and accurate market statistics and insights.
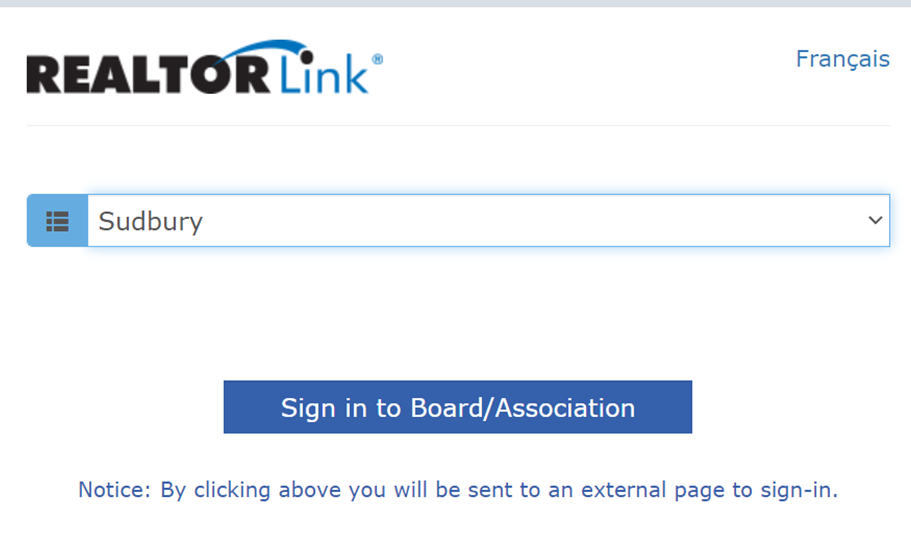
To access the MLS® HPI Tool, visit the REALTORLink® webpage and login to the Sudbury Board, as shown below.
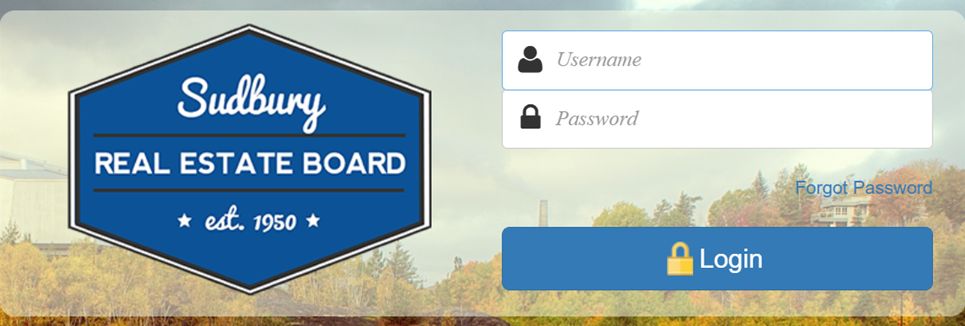
This will bring you to the SREB Login Dashboard, where you will enter your ID and password.
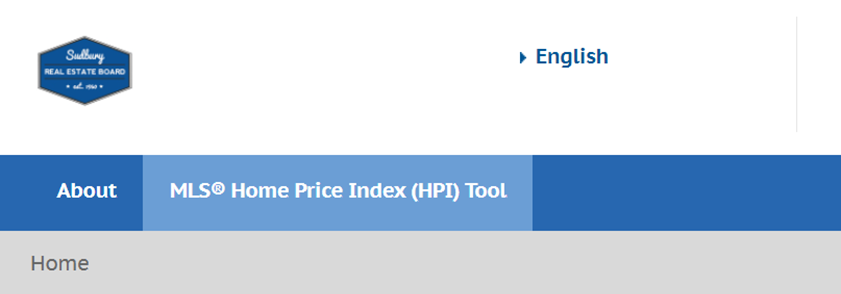
Once you are logged in, click on the “MLS® Home Price Index (HPI) Tool” section next to “About”. From there, you will have access to all the HPI features.
What REALTORS® See
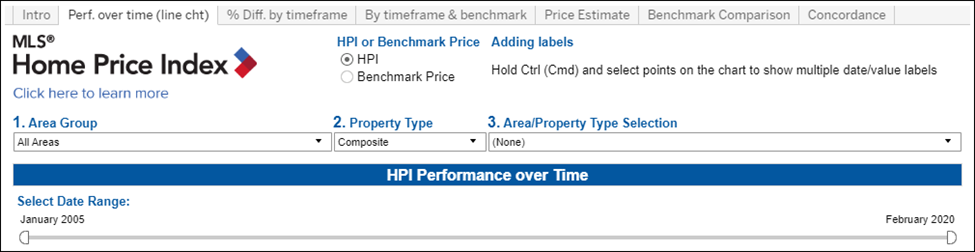
As a licensed REALTOR®, you will see a full dashboard with seven tabs. Each tab provides different actions and offers a different way to visualize the data.
Introduction, Performance over time, Percentage Difference by timeframe, By timeframe and benchmark, Price Estimate, Benchmark Comparison and Concordance.
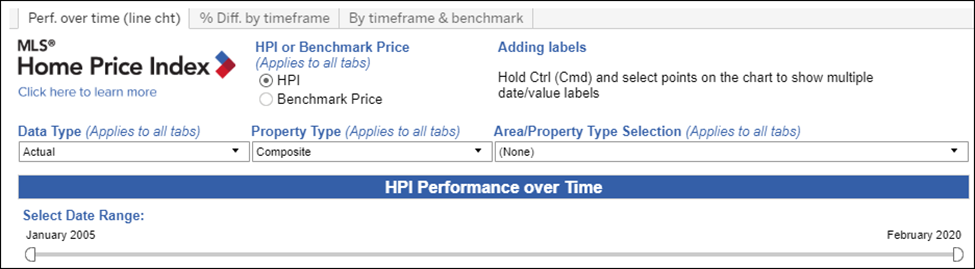
What the Public Sees
The public can view three tabs to navigate the different views of the dashboard. Each tab is labelled with a description of the information contained in that view. The public does not have the ability to drill down to specifics in the same way that REALTORS® can.
Performance over time, Percentage Difference by timeframe and by timeframe and benchmark.
Other Tools
Benchmark Descriptions: In the lower right corner of each tab are links to the current Benchmark Descriptions report. The report shows the description for every benchmark home tracked by the index. Use the bookmarks or the search function (Ctrl+F) to jump to the area of the document you need in the PDF.
Help: In the lower right corner of each tab is a link to the searchable online Help Guide (with walkthrough videos). These show how to use the features of each dashboard tab.
Download Icon: At the bottom right of the dashboard in the toolbar is a Download tool you can use to capture the current selections on the dashboard in the form of an image (PNG format), PDF file, or PowerPoint slideshow, which you can then print or incorporate into an email or a report for your client